
What is the first thing that comes to mind when you need to track system calls made and received by a process? You'll probably think of strace, and you are right. What tool would you use to monitor raw network traffic from the command line? If you thought about tcpdump, you made an excellent choice again. And if you ever run into the need to having to keep track of open files (in the Unix sense of the word: everything is a file), chances are you'll use lsof.
strace, tcpdump, and lsof are indeed great utilities that should be part of every sysadmin's toolset, and that is precisely the reason why you will love sysdig, a powerful open source tool for system-level exploration and troubleshooting, introduced by its creators as "strace + tcpdump + lsof + awesome sauce with a little Lua cherry on top." Humor aside, one of the great features of sysdig resides in its ability not only to analyze the "live" state of a Linux system, but also to save the state in a dump file for offline inspection. What's more, you can customize sysdig's behavior or even enhance its capabilities by using built-in (or writing your own) small scripts called chisels. Individual chisels are used to analyze sysdig-captured event streams in various script-specific fashions.
In this tutorial we'll explore the installation and basic usage of sysdig to perform system monitoring and troubleshooting on Linux.
Installing Sysdig
For this tutorial, we will choose to use the automatic installation process described in the official website for the sake of simplicity, brevity, and distribution agnosticity. In the automatic process, the installation script automatically detects the operating system and installs all the necessary dependencies.
Run the following command as root to install sysdig from the official apt/yum repository:
# curl -s https://s3.amazonaws.com/download.draios.com/stable/install-sysdig | bash
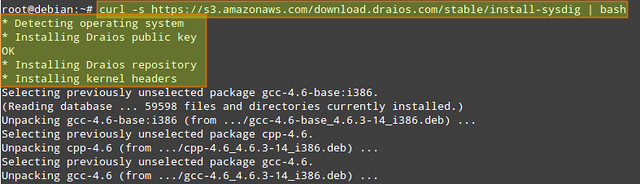
Once the installation is complete, we can invoke sysdig as follows to get a feel for it:
# sysdig
Our screen will be immediately filled with all that is going on in our system, not allowing us to do much more with that information. For that reason, we will run:
# sysdig -cl | less
to see a list of available chisels.
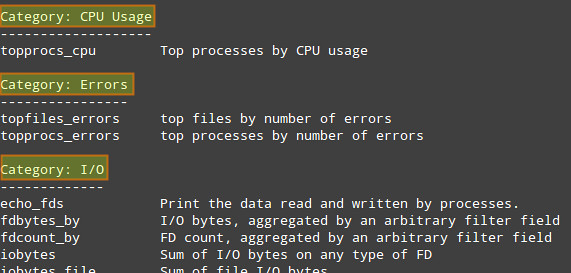
The following categories are available by default, each of which is populated by multiple built-in chisels.
- CPU Usage
- Errors
- I/O
- Logs
- Misc
- Net
- Performance
- Security
- System State
To display information (including detailed command-line usage) on a particular chisel, run:
# sysdig -cl [chisel_name]
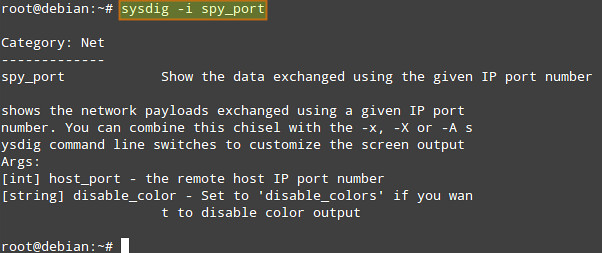
For example, we can check information about spy_port chisel under "Net" category by running:
# sysdig -i spy_port
Chisels can be combined with filters (which can be applied to both live data or a trace file) to obtain more useful output.
Filters follow a "class.field" structure. For example:
- fd.cip: client IP address.
- evt.dir: event direction can be either '>' for enter events or '<' for exit events.
The complete filter list can be displayed with:
# sysdig -l
In the rest of the tutorial, I will demonstrate several use cases of sysdig.
Sysdig Example: Troubleshooting Server Performance
Suppose your server is experiencing performance issues (e.g., unresponsiveness or significant delays in responding). You can use the bottlenecks chisel to display a list of the 10 slowest systems calls at the moment.
Use the following command to check up on a live server in real time. The "-c" flag followed by a chisel name tells sysdig to run the specified chisel.
# sysdig -c bottlenecks
Alternatively, you can conduct a server performance analysis offline. In that case, you can save a complete sysdig trace to a file, and run the bottlenecks chisel against the trace as follows.
First, save a sysdig trace (use Ctrl+c to stop the collection):
# sysdig -w trace.scap
Once the trace is collected, you can check the slowest systems calls that were performed during the capture interval by running:
# sysdig -r trace.scap -c bottlenecks
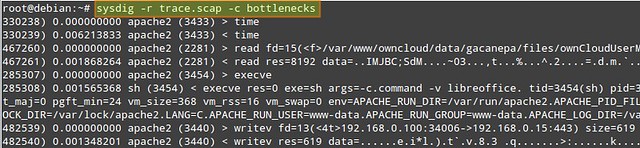
You want to pay attention fo columns #2, #3, and #4, which indicate execution time, process name, and PID, respectively.
Sysdig Example: Monitoring Interactive User Activities
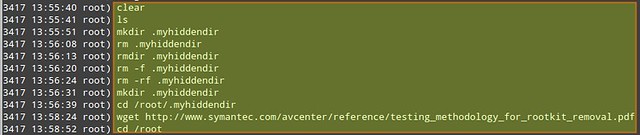
Suppose you as a sysadmin want to monitor interactive user activities in a system (e.g., what command a user typed from the command line, and what directories the user went to). That is when spy_user chisel comes in handy.
Let's first collect a sysdig trace with a couple of extra options.
# sysdig -s 4096 -z -w /mnt/sysdig/$(hostname).scap.gz
- "-s 4096" tells sysdig to capture up to 4096 bytes of each event.
- "-z" (used with "-w") enables compression for a trace file.
- "-w
" saves sysdig traces to a specified file.
In the above, we customize the name of the compressed trace file on a per-host basis. Remember that you can interrupt the execution of sysdig at any moment by pressing Ctrl + c.
Once we've collected a reasonable amount of data, we can view interactive activities of every user in a system by running:
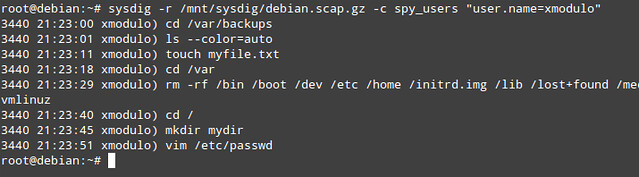
# sysdig -r /mnt/sysdig/debian.scap.gz -c spy_users
The first column in the above output indicates the PID of the process associated with a given user's activity.
What if you want to target a specific user, and monitor the user's activities only? You can filter the results of the spy_users chisel by username:
# sysdig -r /mnt/sysdig/debian.scap.gz -c spy_users "user.name=xmodulo"
Sysdig Example: Monitoring File I/O
We can customize the output format of sysdig traces with "-p" flag, and indicate desired fields (e.g., user name, process name, and file or socket name) enclosed inside double quotes. In this example, we will create a trace file that will only contain writing events in home directories (which we can inspect later with "sysdig -r writetrace.scap.gz").
# sysdig -p "%user.name %proc.name %fd.name" "evt.type=write and fd.name contains /home/" -z -w writetrace.scap.gz

Sysdig Example: Monitoring Network I/O
As part of server troubleshooting, you may want to snoop on network traffic, which is typically done withtcpdump. With sysdig, traffic sniffing can be done as easily, but in more user friendly fashions.
For example, you can inspect data (in ASCII) that has been exchanged with a particular IP address, served by a particular process (e.g., apache2):
# sysdig -s 4096 -A -c echo_fds fd.cip=192.168.0.100 -r /mnt/sysdig/debian.scap.gz proc.name=apache2
If you want to monitor raw data transfer (in binary) instead, replace "-A" with "-X":
# sysdig -s 4096 -X -c echo_fds fd.cip=192.168.0.100 -r /mnt/sysdig/debian.scap.gz proc.name=apache2
For more information, examples, and case studies, you can check out the project website. Believe me, the possibilities are limitless. But don't just take my word for it. Install sysdig and start digging today!
Comments
Understanding MyAssignmentHelp UK:
MyAssignmentHelp UK is a main online platform devoted to giving thorough scholarly assistance to understudies at all degrees of schooling. With a group of experienced tutors, informed authorities, and scholarly experts, the platform offers a different range of administrations intended to address the exceptional requirements of understudies.
Administrations Advertised:
Assignment Assistance: MyAssignmentHelp UK offers customized assistance with assignments across different subjects and trains. From expositions and exploration papers to contextual investigations and theses, understudies can depend on the platform to convey top caliber, well-informed assignments that satisfy scholarly guidelines.
Tutoring Administrations: not with standing assignment help, my assignment help uk furnishes one-on-one tutoring meetings with experienced tutors. These meetings offer understudies the chance to explain ideas, look for customized guidance, and enhance their understanding of course material.
Altering and Editing: The platform offers altering and editing administrations to help understudies clean their assignments and guarantee clearness, intelligibility, and adherence to scholastic shows. Master editors survey assignments for sentence structure, accentuation, spelling, and generally speaking quality.
Test Arrangement: MyAssignmentHelp UK offers thorough test readiness administrations, including practice tests, concentrate on guides, and survey materials, to help understudies plan successfully for tests and evaluations.
Paper Assistance: For understudies undertaking advanced research projects, MyAssignmentHelp UK gives complete exposition assistance, including topic determination, proposition composing, writing audit, information analysis, and theory formulation.
Advantages of MyAssignmentHelp UK:
Quality Assurance: MyAssignmentHelp UK is focused on conveying great scholarly arrangements that comply with scholastic standards and rules. Each assignment is carefully investigated, composed, and assessed to guarantee precision, inventiveness, and relevance.
Opportune Conveyance: The platform understands the importance of complying with time constraints and endeavors to convey assignments expeditiously. Understudies can depend on MyAssignmentHelp UK to present their work on time and stay away from late punishments.
Customized Help: MyAssignmentHelp UK offers customized help custom-made to the singular requirements and inclinations of every understudy. Whether it's tending to explicit scholastic difficulties or giving guidance on concentrate on procedures, the platform guarantees that understudies get the help they need to succeed.
Affordability: MyAssignmentHelp UK offers cutthroat valuing and adaptable payment choices to make its administrations available to understudies from all foundations. With affordable rates and transparent estimating, the platform endeavors to ease financial weights and engage understudies to put resources into their scholastic achievement.
Customer Fulfillment: MyAssignmentHelp UK focuses on customer fulfillment, encouraging open correspondence, input, and consistent improvement. The platform is devoted to surpassing understudy assumptions and guaranteeing a positive encounter for each client.